Server management GUI tools
Table of Contents
If you want to monitor or manage your server via a browser interface, you can do it with these free tools.
Cockpit
- Cockpit is a server management tool with a browser interface you can install easily:
#Ubuntu
sudo apt install cockpit -y- You need to open port 9090 if you want to access outside server local network (you can also do SSH forwarding, check: Redirecting ports with SSH, or use a reverse proxy with nginx or apache).
- Check if cockpit service is active and running:
sudo systemctl status cockpitIf not, enable it and run it:
sudo service cockpit start- Go to:
https://<SERVER-IP>:9090. If you see a warning message, don’t worry, this is because Cockpit is using a self-signed SSL certificate, click “Advanced settings” option and accept the “risk”. - Cockpit is simply an interface for your server’s system, so it uses your server’s username and password to access.
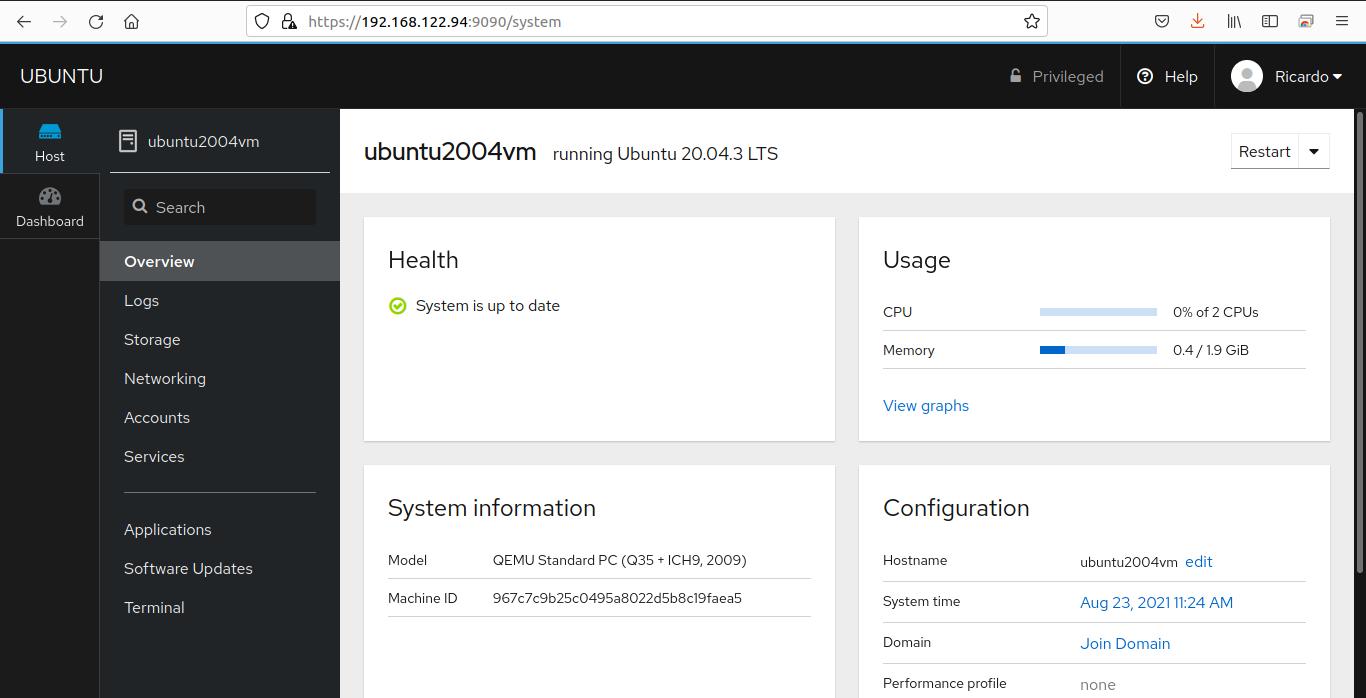
- By default, if server operating system is Ubuntu, Cockpit doesn’t detect network configuration correctly, so you need to add a line in one of your server config files,
/etc/netplan/00-installer-config.yaml:
sudo vim /etc/netplan/00-installer-config.yamlAdd the following line below network line:
renderer: NetworkManagerThen, save the file, close your text editor and type:
sudo netplan tryPress Enter to accept the changes. If no message appears, and you are connecting to a server via SSH with its local IP, this is because this new configuration has changed the server’s assigned local IP. Try again but using the server directly, don’t access through SSH.
NetData
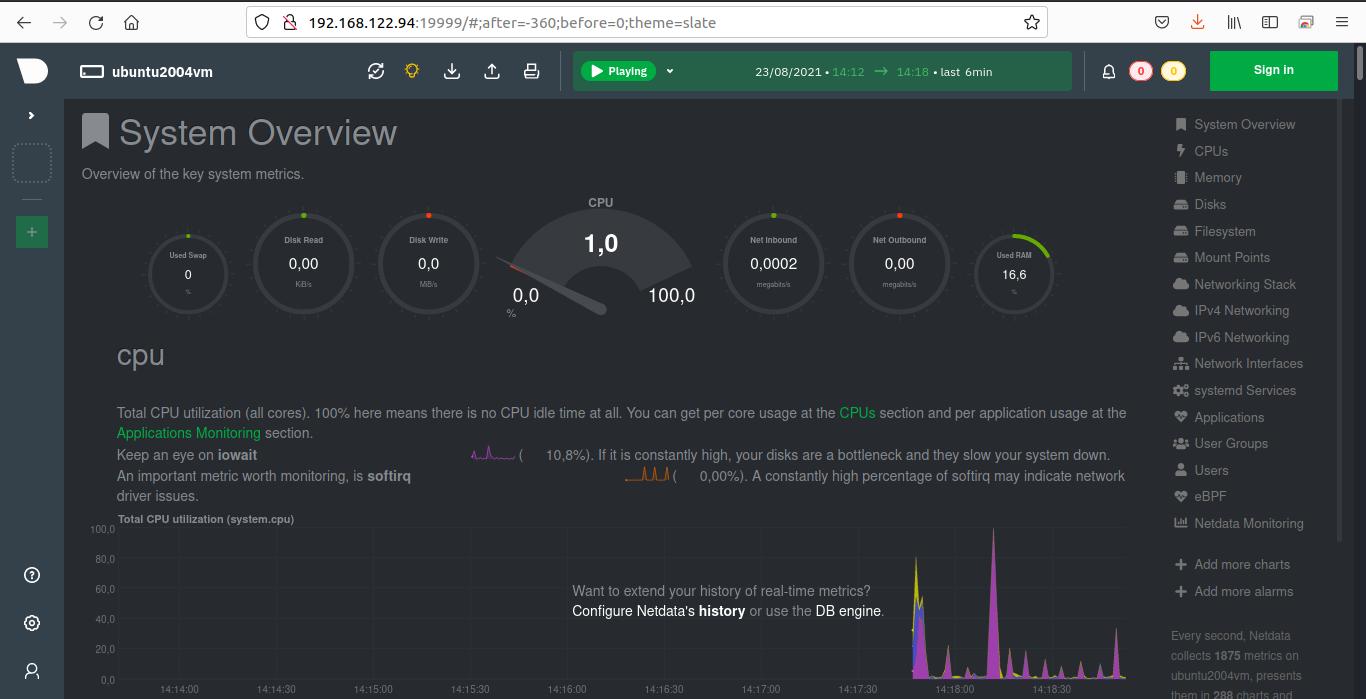
- NetData is a server monitor tool you can install as easy as Cockpit:
bash <(curl -Ss https://my-netdata.io/kickstart.sh)
# Check NetData webpage for more info about this command and other installation options
Press Enter to accept the prompts. The installation process may take some time to complete.
2. You need to open port 19999 if you want to access outside your server local network and you don’t want to use SSH forwarding (Redirecting ports with SSH) or a reverse proxy.
3. Then go to http://<SERVER-IP>:19999.
Linux Dash
A simple & low-overhead web dashboard for linux systems. You can use it with Node, Go, PHP and Python. These are the installation instructions for Node:
- Clone the repo.
git clone --depth 1 https://github.com/afaqurk/linux-dash.git- Go to
linux-dash/app/serverand runnpm install.
cd linux-dash/app/server
npm install --production- Start the server.
node index.jsDefault port is 80, but you can change it with the parameter -p when starting the server.
WeTTY
If you only want a browser-based terminal, WeTTY is a good option. These are the steps to install it on a Ubuntu system:
- Download and install Node.js 14 and other required packages:
sudo apt update
sudo apt-get install -y curl git apt-utils make g++
curl -fsSL https://deb.nodesource.com/setup_14.x | sudo bash -
sudo apt-get install -y nodejs- Install Yarn (a Node.js package manager).
sudo npm install -g yarn- Download WeTTY.
git clone https://github.com/butlerx/wetty.git- By default, WeTTY has an options menu that doesn’t work very well, You can disable it by opening
wetty/src/assets/scss/options.scssand adding this line to#optionsblock:
display: none- Go to
wettyfolder and compile WeTTY.
cd wetty
yarn
yarn build- Create a service file, so WeTTY will start when server starts up.
sudo vim /lib/systemd/system/wetty.service[Unit]
Description=Starts wetty
After=network.target
StartLimitIntervalSec=0
[Service]
Type=simple
Restart=on-failure
RestartSec=1
User=root
ExecStart=node /home/ubuntu/wetty/ --title 'WEB TITLE' -b '/' &
[Install]
WantedBy=multi-user.target- Reload
systemctland enable the service.
sudo systemctl daemon-reload
sudo systemctl start wetty.service
sudo systemctl enable wetty.service- Default port is 3000, but you can change it by adding
-p PORTat theExecStartline, before&. - Then you can go to
http://<SERVER-IP>:3000and type your server username and password.
Monitorix
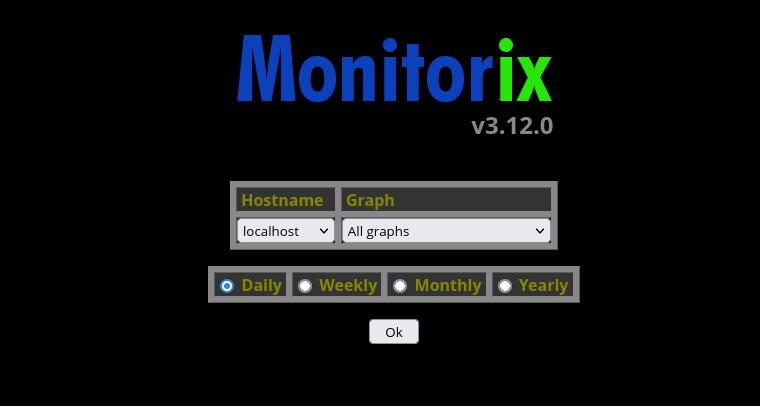
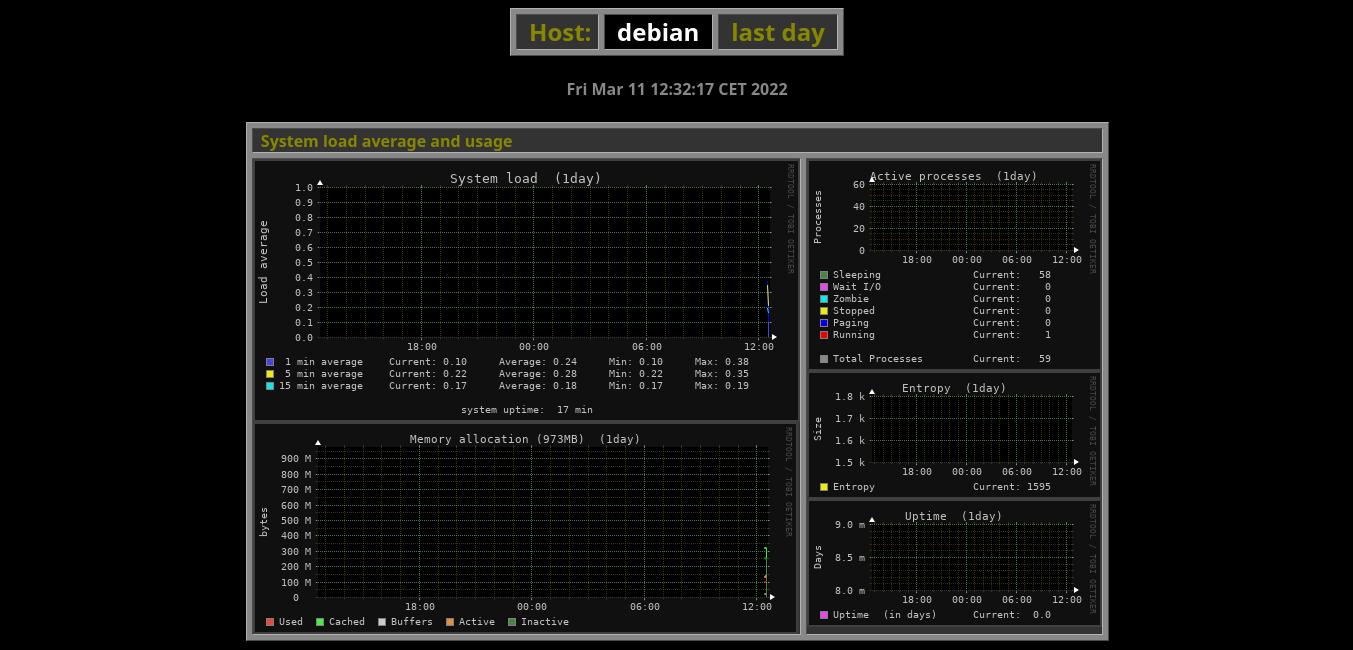
Lightweight and easy-to-install system monitoring tool. Just run (on Debian/Ubuntu):
sudo apt install monitorixThen, go to http://<server-ip>:8080/monitorix. For installation instructions on other distros, check its webpage.
Configuration files are inside /etc/monitorix/conf.d/. These files overwrite default settings inside /etc/monitorix/monitorix.conf. Check https://www.monitorix.org/manpage.html and the default config file for more details. This is an example of a config file:
# /etc/monitorix/conf.d/00-debian.conf

title = "Web monitoring"
refresh_rate = 60
show_gaps = y
image_format = svg
enable_hourly_view = y
base_url = /

<httpd_builtin>
        user = monitorix
        group = monitorix
</httpd_builtin>

<mysql>
        conn_type = socket
        list = /run/mysqld/mysqld.sock
        <desc>
                /run/mysqld/mysqld.sock = 3306, user, secret
        </desc>
</mysql>

<apcupsd>
        cmd = /sbin/apcaccess
</apcupsd>
Click on a graph to enlarge. They are static graphs (they don’t update in real time) but the page updates every 150 seconds (by default). If you need a simple tool that does not consume system resources, it’s a great choice.
If you have any suggestion, feel free to contact me via social media or email.
Latest tutorials and articles:
Featured content:

