How to check open ports and network usage
Table of Contents
If you need to verify whether an application has established a network connection or how many ports are open on your network, you can use any of these tools.
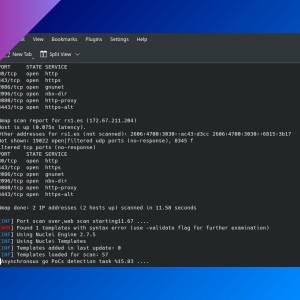
nmap
nmap allows you to see which network ports are open on any device. This is the basic usage:
nmap IP
# where IP is an IP address (local or public), an IP range or a CIDR block.
# You can also use hostnames.
nmap 192.168.1.12
nmap 192.168.1.1-20
nmap 192.168.1.0/24- You can go to IpAddressGuide to learn how to type a CIDR.
By default, it shows ports that are open:
- ‘open’ means that an application is actively accepting TCP connections, UDP datagrams or SCTP associations on that port.
- ‘filtered’ means that some firewall prevents
nmapto reach that port. - ‘closed’ means port is accesible but there is no application listening on it.
By default, nmap checks 1000 common ports (TCP), but you can scan an specific port with -p PORT where PORT can be a number or a range.
nmap -p 80 192.168.1.10To scan UDP ports, you need to add -Su and -p U: and the port number, several numbers separated by commas or a range.
Other parameters you can use are:
-Pn: treat hosts as online, skip host discovery.-sn: ping scan (disable port scan).-n: disable DNS resolution (faster scans).-sV: show more info about service that is using a port.-F: reduce the number of scanned ports in the default scan to 100.-v: increase verbosity of the scan process.-T<0-5>: set timing template (higher is faster).-A: enable OS detection, version detection, script scanning, and traceroute.--open: show only open ports.
You can learn more at the man page (man nmap).
masscan
Another port scanning utility. Following command checks if any device in the local network has port 22 open.
# you may need to use 'sudo' or log in as root
masscan 192.168.1.0/24 -p22
-p <port range>: this parameter is required. UDP ports: add ‘U:’ before the port (e.g.:-p U:1194).--ping: add a ping request.--rate <requests per second>.
ss
This utility (from the iproute2 package) shows information about which applications are connected to the network. The following command will show all established TCP connections (sockets) and the process name (and ID) that invoke every connection.
ss -ntp
# 'n' stands for not trying to resolve service names (always shows the port number),
# 't' for 'tcp',
# and 'p' for showing process info
$ ss -ntp
State Recv-Q Send-Q Local Address:Port Peer Address:Port Process
ESTAB 0 0 192.168.1.XX:38500 XXX.XX.XX.XXX:443 users:(("vivaldi-bin",pid=47567,fd=26))
ESTAB 0 0 192.168.1.XX:58678 XX.XXX.XXX.XXX:993 users:(("thunderbird",pid=10399,fd=49))
CLOSE-WAIT 1 0 127.0.0.1:57900 127.0.0.1:4000 users:(("vivaldi-bin",pid=47567,fd=39))
ESTAB 0 0 192.168.1.XX:47356 XX.XX.XXX.XXX:50332 users:(("syncthing",pid=803,fd=12))
ESTAB 0 0 127.0.0.1:35729 127.0.0.1:46256 users:(("bundle",pid=78907,fd=15))
ESTAB 0 0 192.168.1.XX:49770 XXX.XXX.XXX.XXX:443 users:(("Discord",pid=3202,fd=28)) You can use other parameters (more info at the man page):
-l: show only listening sockets.-u: show UDP sockets.-a: show listening and non-listening sockets.-o state <state>: filter by state (established, close, listening, etc.)
netstat
netstat (from the net-tools package) can provide a similar output than ss. Add the -4 or -6 parameter for IPv4 or IPv6 network connections, or --tcp, --udp for TCP or UDP. By default, only shows listening sockets, add -a to also display non-listening ones.
$ netstat --tcp
Active Internet connections (w/o servers)
Proto Recv-Q Send-Q Local Address           Foreign Address         State
tcp        0      0 myarch:60098            ipXXX.ip-XXX-XX-X:https ESTABLISHED
tcp        0      0 myarch:57232            XX.XX.XXX.XXX:https     ESTABLISHED
tcp        0      0 myarch:45810            XX.XX.XXX.XXX:https     ESTABLISHED
jnettop
A top-like console network traffic visualizer. You need to run it with sudo if your user does not have required permissions.
tshark
It’s the CLI version of WireShark (wireshark-cli package). Capture packet data and write it to standard output or to a file. You need to run it with sudo if your user does not have required permissions.
tshark > packets.txttcpdump
Similar to tshark, shows a description of the content of network packets. Run with sudo. You can redirect the output to a file. Check its man page for a complete manual, I will show you some examples of usage (tcpdump [<options>] <expression>):
# Display first 100 packets info
tcpdump -c 100
# Display IP packets
tcpdump ip# Print out info about IP packets on port 443 TCP (HTTPS)
tcpdump tcp port 443# Show IP packets on ICMP (ping)
tcpdump icmpIf you have any suggestion, feel free to contact me via social media or email.
Latest tutorials and articles:


Featured content: