Monitor your network bandwidth with these tools
Table of Contents
Command-line and GUI applications to display your network bandwidth.
Note: on some applications you will see bandwidth info is separated into ‘RX’ and ‘TX’. RX stands for ‘Receive’ and displays inbound (download) traffic. TX means ‘Transmission’ and displays outbound (upload) traffic.
bmon (CLI)
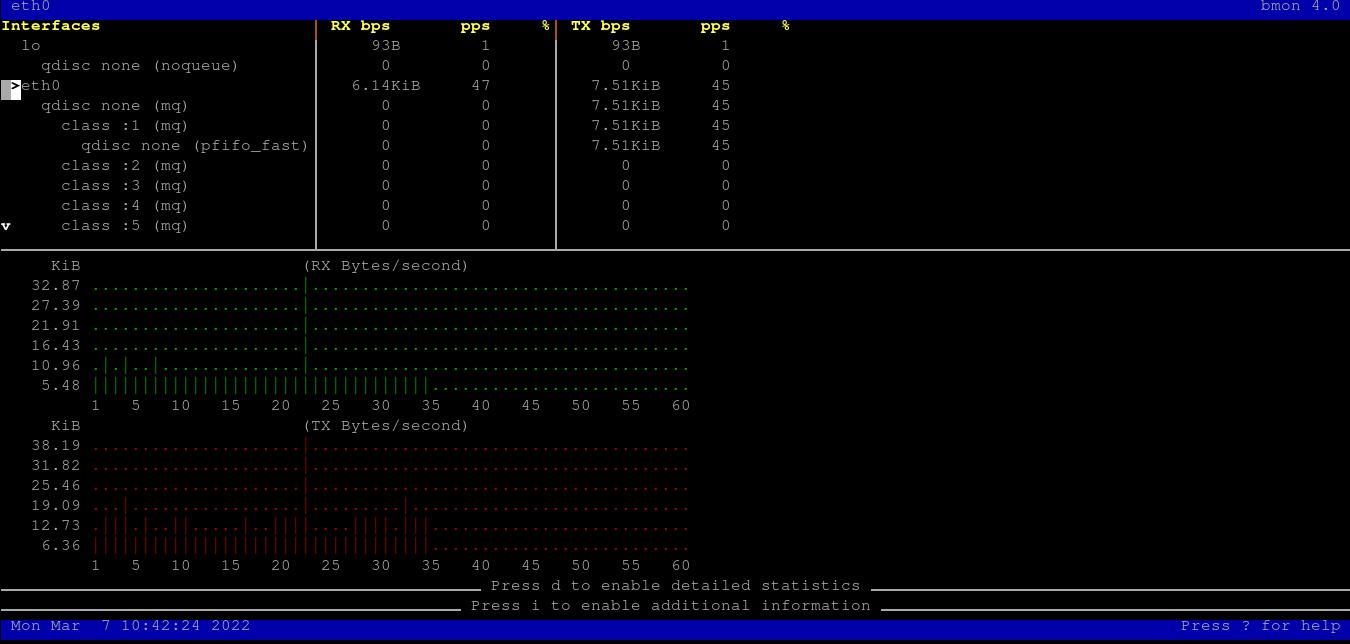
bmon ‘is a monitoring and debugging tool to capture networking related statistics and prepare them visually in a human friendly way’. Use arrow keys to select a network interface and display inbound and outbound traffic charts. You can also press D and I to display more statistics (you will need to scroll down to see them). Check man bmon for more info.
nload (CLI)
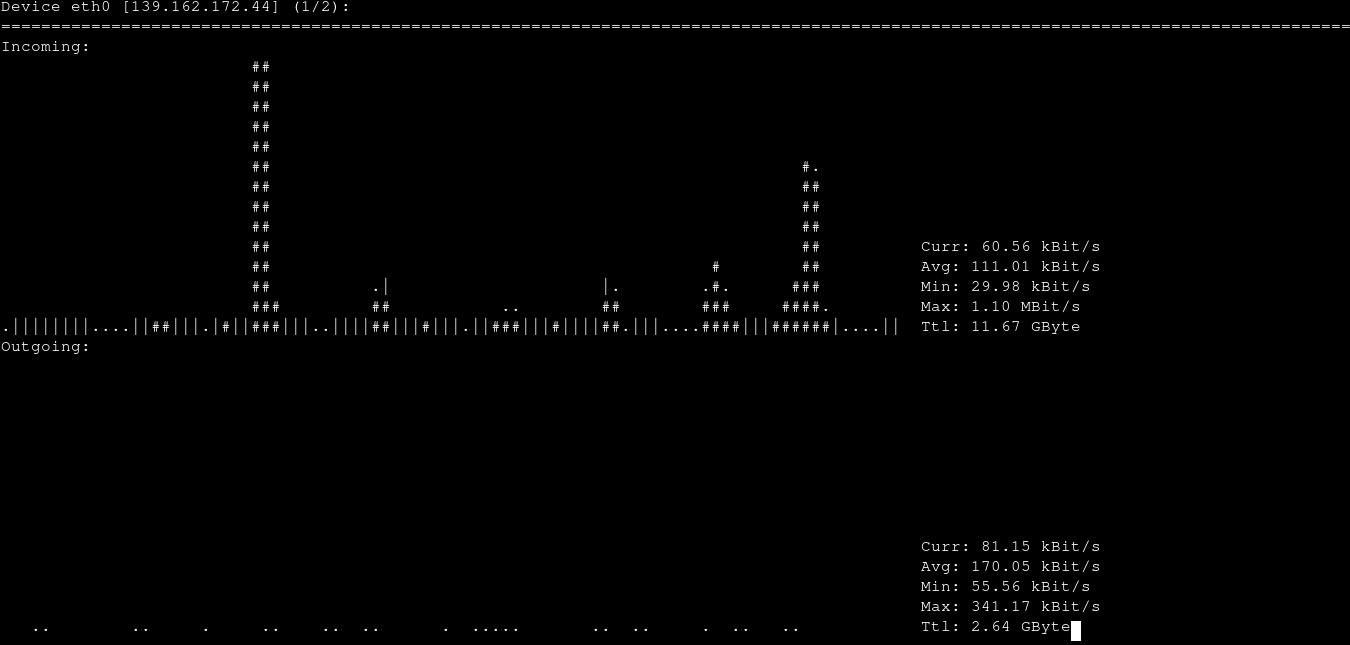
nload ‘is a console application which monitors network traffic and bandwidth usage in real time.’ It’s simpler than bmon. It displays two graphs for inbound and outbound traffic. You can change some graph settings by adding parameters to nload. For example, nload -i 1024 set the 100% mark to 1024 kB/s. Check man nload for more info.
iftop (CLI)
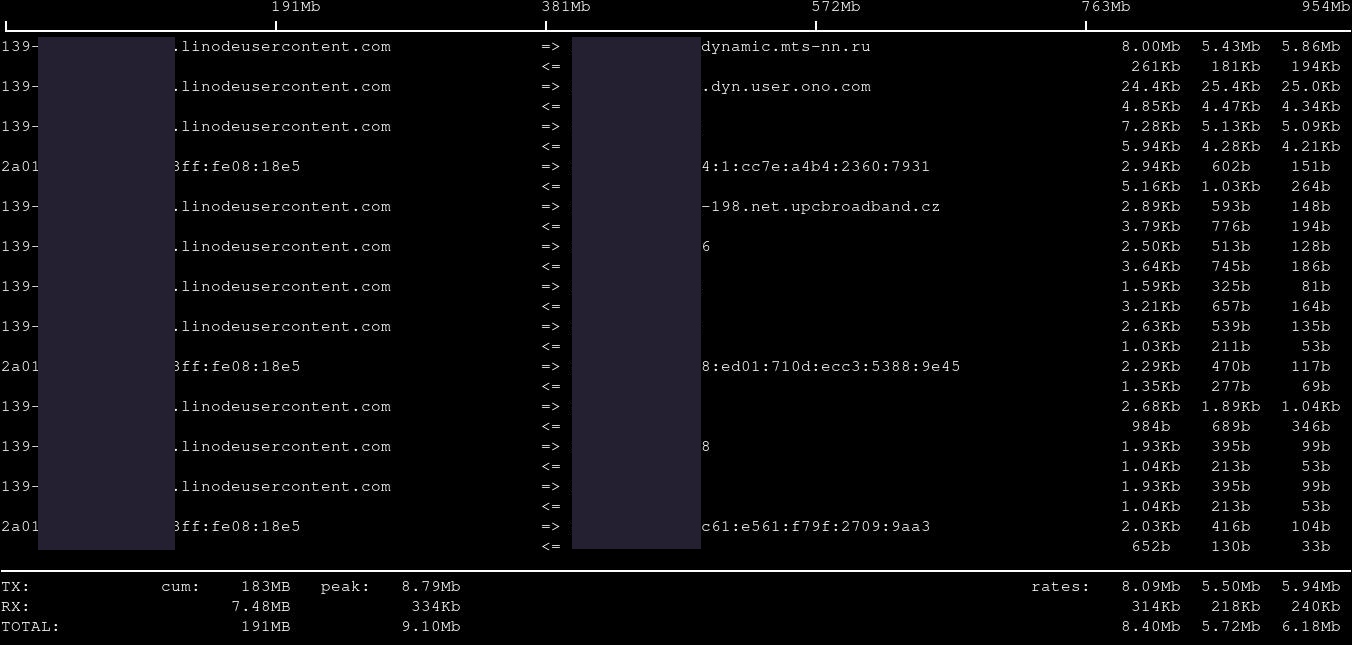
iftop shows info about network packets and global bandwidth info. Press H while running iftop to get more info about sorting, displaying more statistics, etc.
Wireshark (GUI)
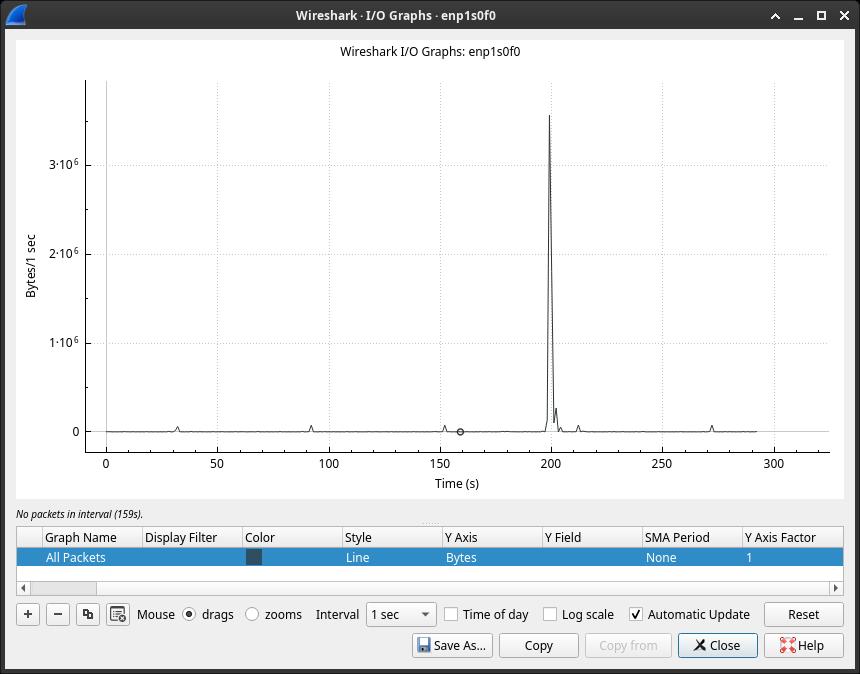
The most popular network protocol analyzer, Wireshark, also has useful I/O graphs. Go to Statistics -> I/O Graphs.
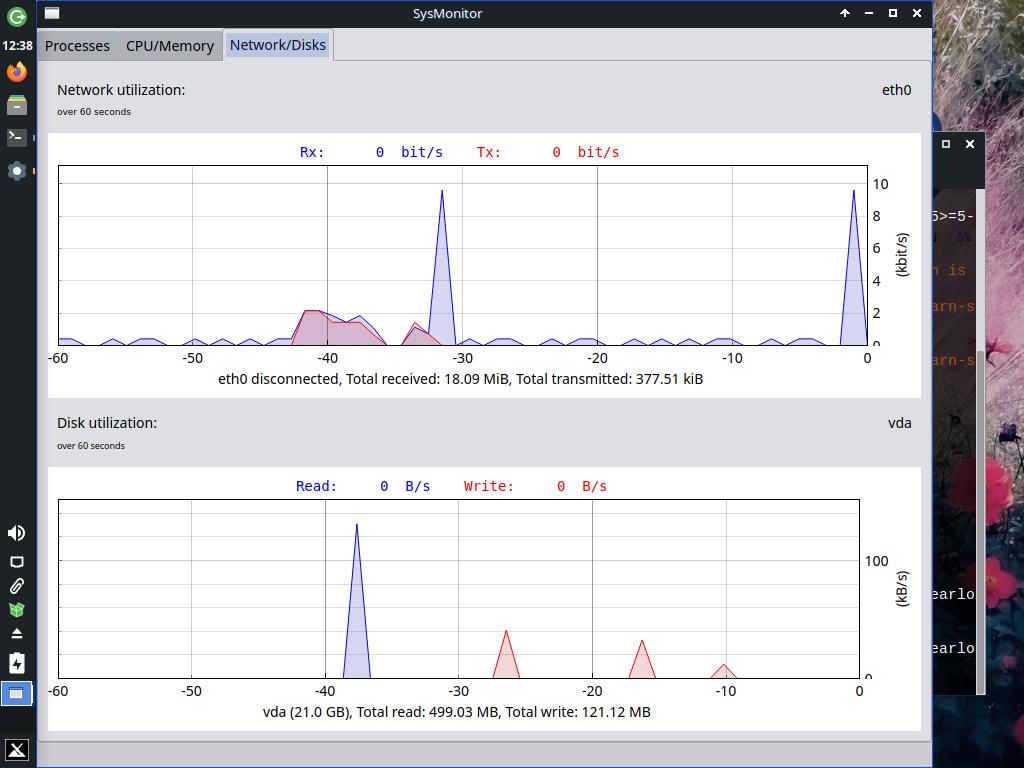
SysMonitor (GUI)
It’s a system monitor that displays a process list, CPU, memory, network and disk graphs. You can install it with pip:
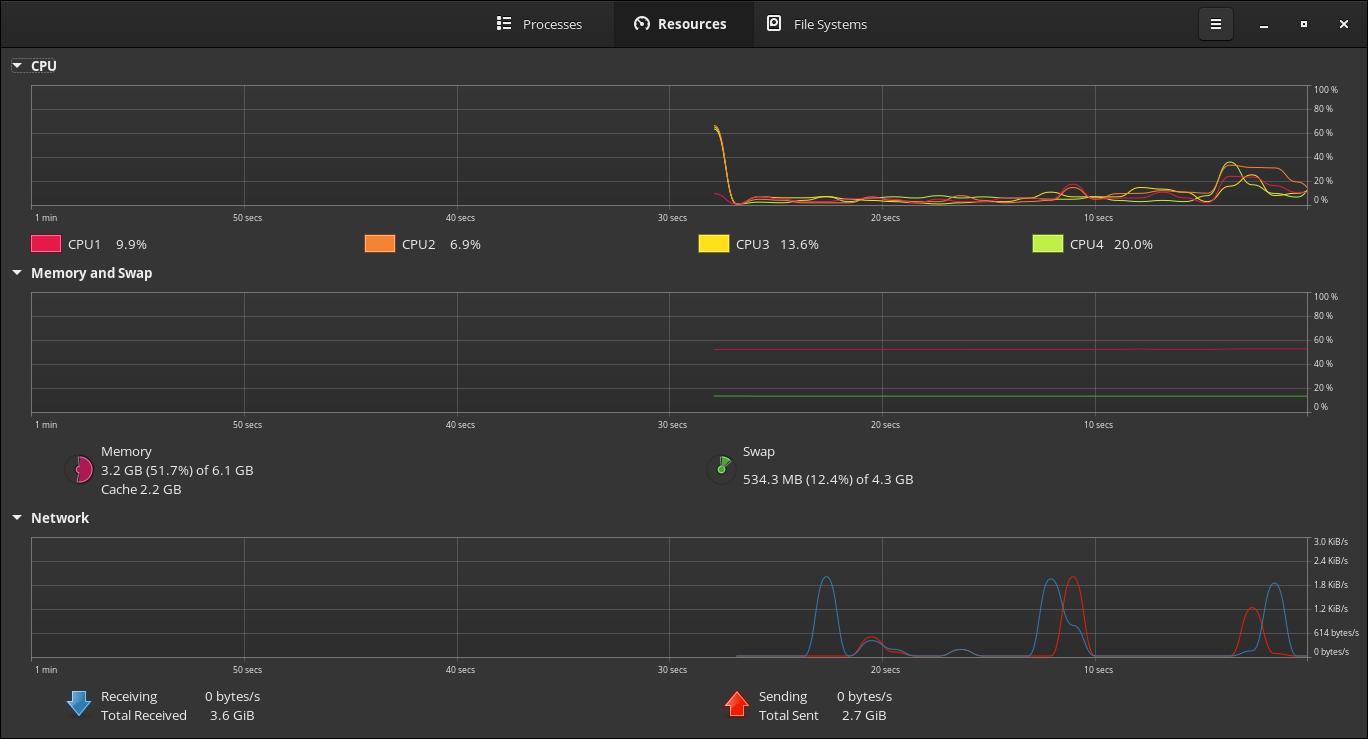
pip install sysmonSystem Monitor - GNOME (GUI)
Default GNOME System Monitor also shows information about your network bandwidth usage.
If you have any suggestion, feel free to contact me via social media or email.
Latest tutorials and articles:
Featured content:

