Starting with Prometheus: a basic setup using containers
Table of Contents
- Documentation
- Docker / Podman
- Container structure
- Create a container network
- Create a Prometheus configuration file
- Create Prometheus server container
- Create Node exporter container
- Define a new target
- Restart Prometheus container
- Access Prometheus GUI
- Extra: configuring Grafana
- Learn More
If you want to start learning Prometheus, the popular monitoring tool, you can create a very basic but fully functional Prometheus server using Docker containers.
Documentation
You can go to https://prometheus.io/docs/introduction/overview/ to learn about Prometheus, their architecture and how to install and use it. This tutorial is based on that documentation and https://hub.docker.com/u/prom.
Docker / Podman
I am going to use Podman as the container manager but you use Docker just by replacing podman with docker in the following commands.
Container structure
We are going to use two containers: one for Prometheus itself and another for the “Node exporter” to monitor system resources. Containers will be inside a container network.
Create a container network
We are going to create a network for the Prometheus container and node exporter container:
podman network create prometheusCreate a Prometheus configuration file
Create a file called prometheus.yml (place it in a separate folder because we are going to mount that folder into the container later). Edit the file to add this:
global:
  scrape_interval:     15s
  evaluation_interval: 15s

rule_files:
  # - "first.rules"
  # - "second.rules"

scrape_configs:
  - job_name: prometheus
    static_configs:
      - targets: ['localhost:9090']
We are defining one simple target that just monitor Prometheus itself. We will edit this file again later to add a second target.
Create Prometheus server container
To be able to access Prometheus GUI, we need to “publish” port 9090. We also mount the folder in which the configuration file is located. Run:
podman run -d --network=prometheus -p 9090:9090 --name promserver -v <path/to/config>:/etc/prometheus docker.io/prom/prometheus- You can name the container whatever you want.
- Replace
<path/to/config>with the full path to the folder, e.g.:/home/user/prometheus-folder. - If you use
docker, removedocker.io/from the image name.
Create Node exporter container
The Node exporter allows to monitor system resources, like CPU usage.
podman run -d --network=prometheus --name promnode docker.io/prom/node-exporter-linux-amd64- You can name the container whatever you want.
- If you use
docker, removedocker.io/from the image name.
Define a new target
We need to add a new target in our config file, so Prometheus can detect the Node exporter.
Edit prometheus.yml and add this to the end (respect the spaces):
  - job_name: node
    static_configs:
- targets: ['promnode:9100']- Replace
promnodewith your node exporter container name if it’s different.
prometheus.yml will look like this:
global:
  scrape_interval:     15s
  evaluation_interval: 15s

rule_files:
  # - "first.rules"
  # - "second.rules"

scrape_configs:
  - job_name: prometheus
    static_configs:
      - targets: ['localhost:9090']
  - job_name: node
    static_configs:
      - targets: ['promnode:9100']
Restart Prometheus container
For Prometheus to be able to load the new target, we need to restart Prometheus process inside the server container. Run:
podman exec promserver kill -s SIGHUP 1- Replace
promserverwith your Prometheus server container name if it’s different. 1is the PID (Process ID) of prometheus process. You can runpodman exec promserver psto check that:
  $ podman exec promserver ps
  PID   USER     TIME  COMMAND
      1 nobody    0:08 /bin/prometheus --config.file=/etc/prometheus/prometheus.yml --storage.tsdb.path=/prometheus --web.console.libraries=/usr/share/prometheus/console_libraries --web.console.templates=/usr/share/prometheus/consoles
     12 nobody    0:00 ps
Access Prometheus GUI
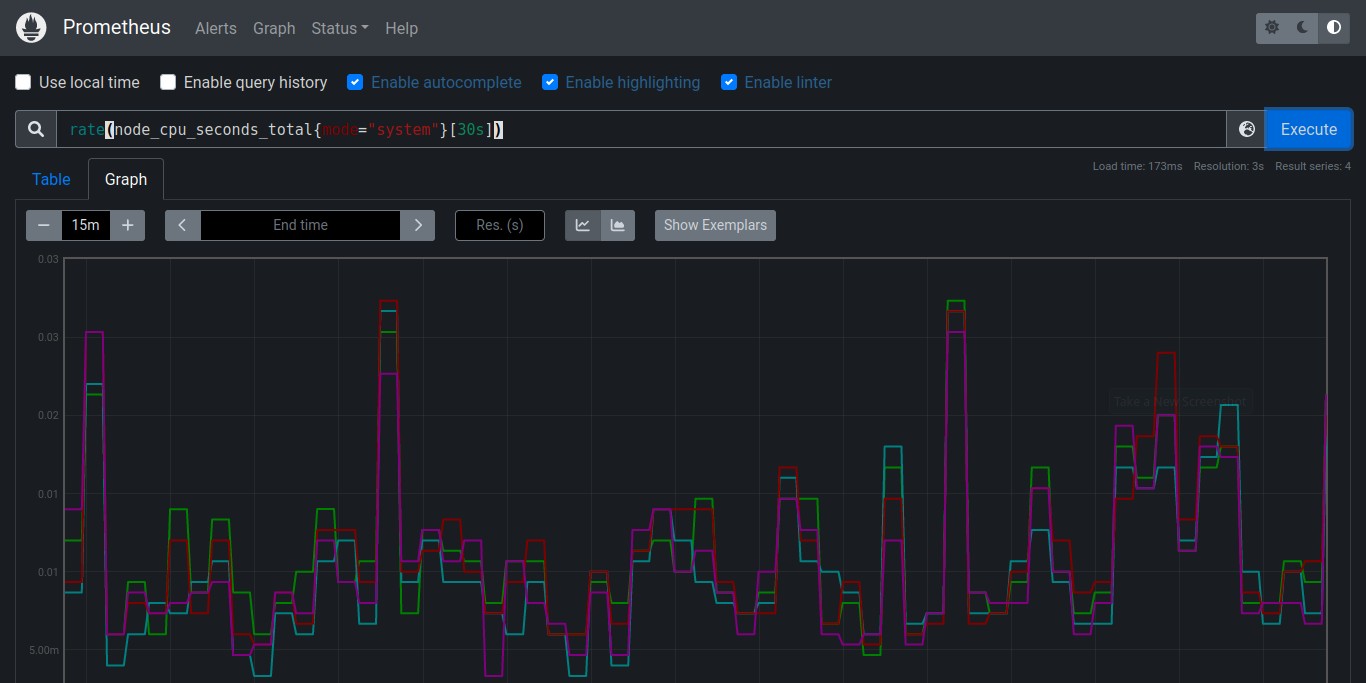
Open a web browser and go to: http://localhost:9090. To check if our Node exporter works, click on “Graph” and paste this query inside “Expression” bar and press Enter (or click “Execute”):
rate(node_cpu_seconds_total{mode="system"}[30s])- This will show you CPU usage per core.
Extra: configuring Grafana
Grafana is a dashboard to visualize your collected data with great graphs. It’s pretty simple to configure and connect to Prometheus. First, run Grafana container:
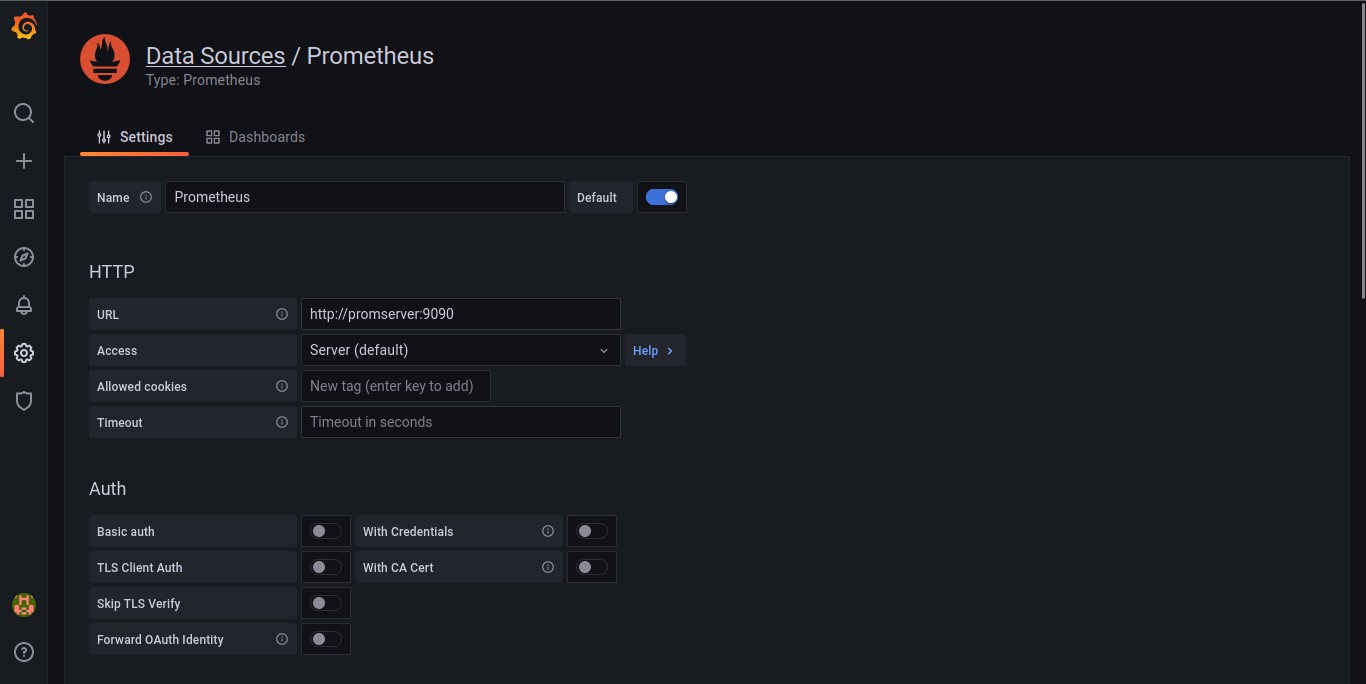
podman run -d --network=prometheus --name grafana -p 3000:3000 docker.io/grafana/grafanaNow, go to http://localhost:3000 and type the default credentials: admin / admin. Add a new password when prompted. Click on the cogwheel icon. Under “Data Sources”, click “Add data source”. Select “Prometheus” and add the Prometheus server URL, e.g.: http://promserver:9090. Replace promserver with your Prometheus server container name if it’s different.
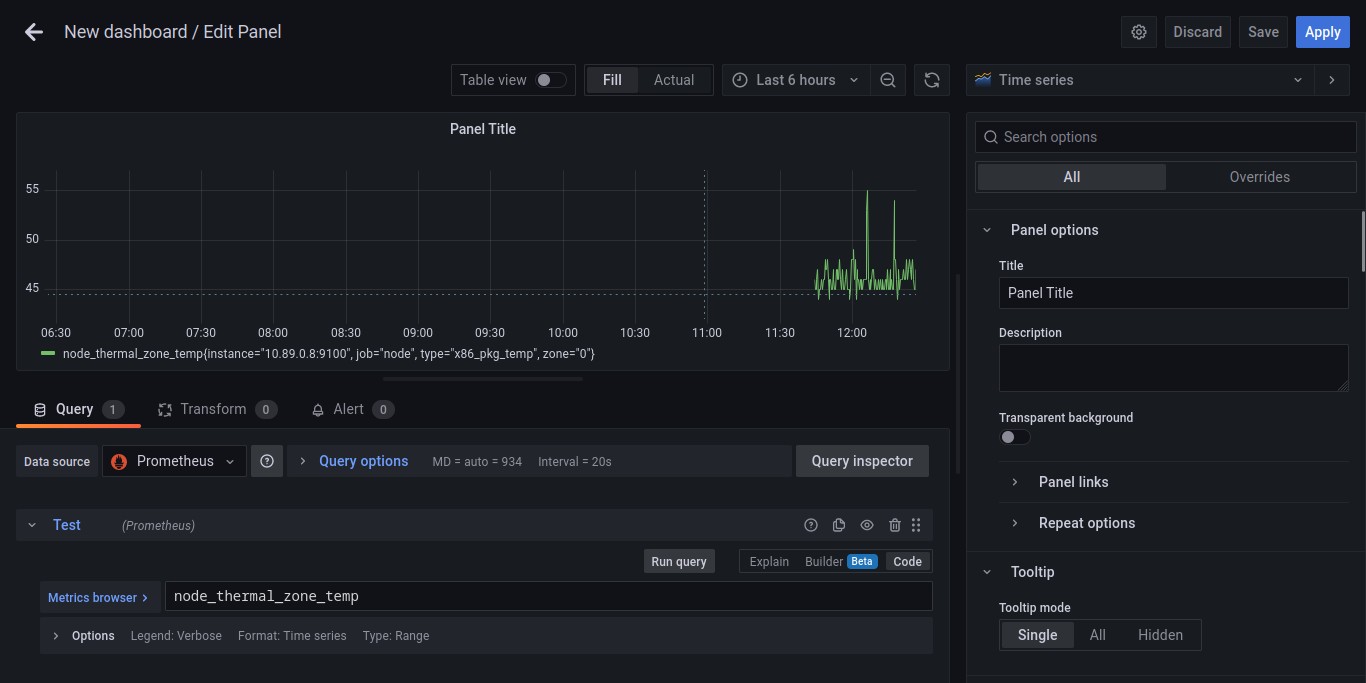
Scroll to the bottom and press “Save & test”. If it connects successfully you can create a new dashboard (by clicking the ”+” icon). Click “Add a new panel”. Under “Query” tab, make sure Prometheus data source is selected. Then, inside “Metrics Browser” bar, add a Prometheus query (e.g.: node_thermal_zone_temp). You’ll see a graph showing CPU temperature. Click “Apply” to save. Finally, click on the diskette icon on the top-right to save the new dashboard.
Learn More
This is just an starting point. There are a lot of online resources to learn about Prometheus and Grafana.
If you have any suggestion, feel free to contact me via social media or email.
Latest tutorials and articles:
Featured content:

